
This week’s post is about the latest IPCC report AR6 WG III. Many people working in the environment sector may have complained about these long and fancy reports from IPCC. I totally agree with them – even scientists who work in the climate change field would struggle to understand (and explain) the definitions of some terms, such as vague “uncertainty range”, and multiple “modeled pathways”.
So, the initiative is that (maybe) I can help summarize the report in a more plain language that is more reader-friendly to the general public. The way I will write about it is by focusing on figures (usually texts are too long to read, but explaining figures with some simple and plain texts will be extremely helpful) Hopefully, you can read my writing in 30-60 min, that can help save a huge amount of time submerged by the original IPCC report. Please do leave your comments or questions if you think it is helpful.
What is the report about?
The Intergovernmental Panel on Climate Change, or IPCC, is an international organization under the United Nations, to provide policymakers with regular scientific assessment reports (AR) on climate change. There are three working groups (WGs) under IPCC and they each work on different aspects of climate change:
- WG I about the physical mechanisms of climate change and our scientific understanding of it;
- WG II about how climate change impacts human society, economically and socially;
- and WG III about what are the mitigations that we can facilitate to combat climate change.

The AR6 report from the WG III was just out this year and it deals with the mitigation side – i.e. where we are right now, what tools we have at the table, how effective they are, what the costs are, what else is needed, what we can do improve the such situation, etc.
The report is structured in the following sections:
- B is about where we are now and where it is trending
- C is about the potential ways that are needed to transform our current system to achieve carbon emission goals
- D is to assess the synergies and trade-offs of these climate actions under the UN Sustainable Development Goals
- E is about ways to strengthen our responses from multiple levels, facilitating such actions to benefit more countries, communities, individuals, etc.
Now, let’s begin with the 8-figure summary.
Where are we right now? (B. Recent developments and current trends)
Global CO2 emissions are still on an increasing trend.
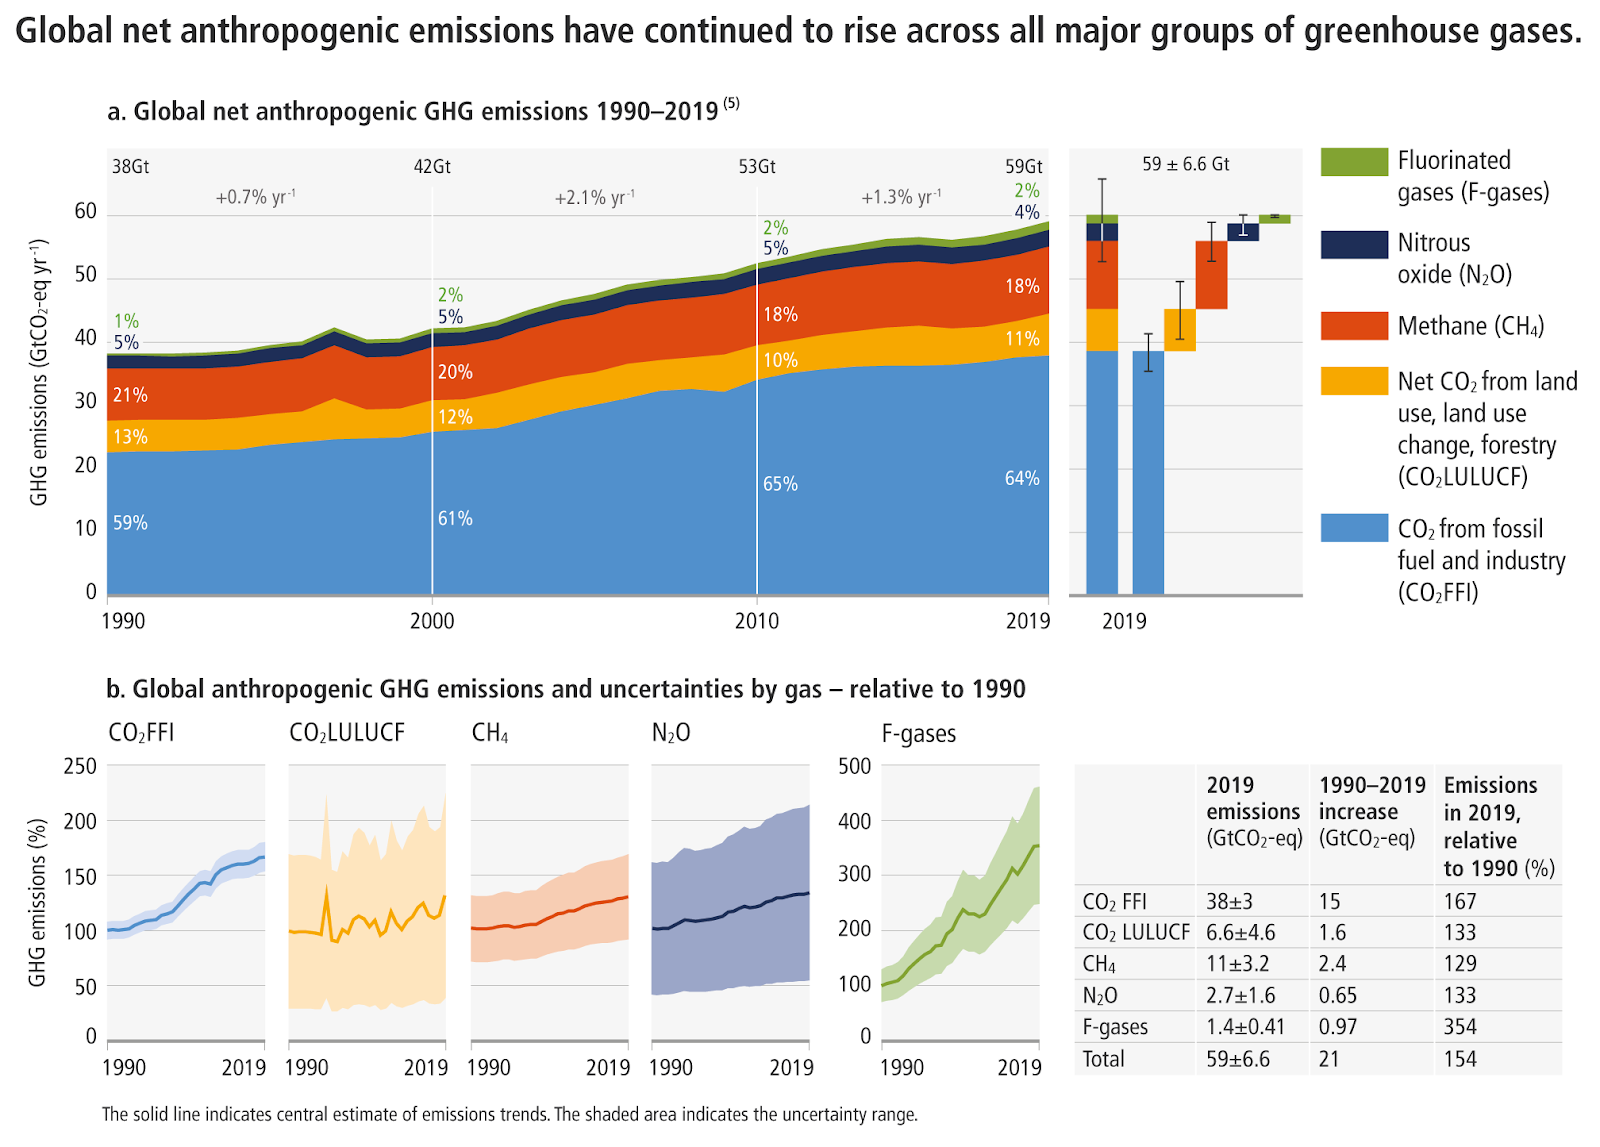
Figure SPM.1 shows an evidently increasing trend for all greenhouse gases (GHGs) emissions from 1990 to 2019 (30-year) (and breaking down to 5 major contributors).
It is worthnoting that the CO2 emission from fossil fuel and industry, which is dominant in all five GHGs, despite showing a growing trend, its increment from 2010-2019 is slower than that from 2000-2009. One silver lining from this giant cloud (Ahaa).
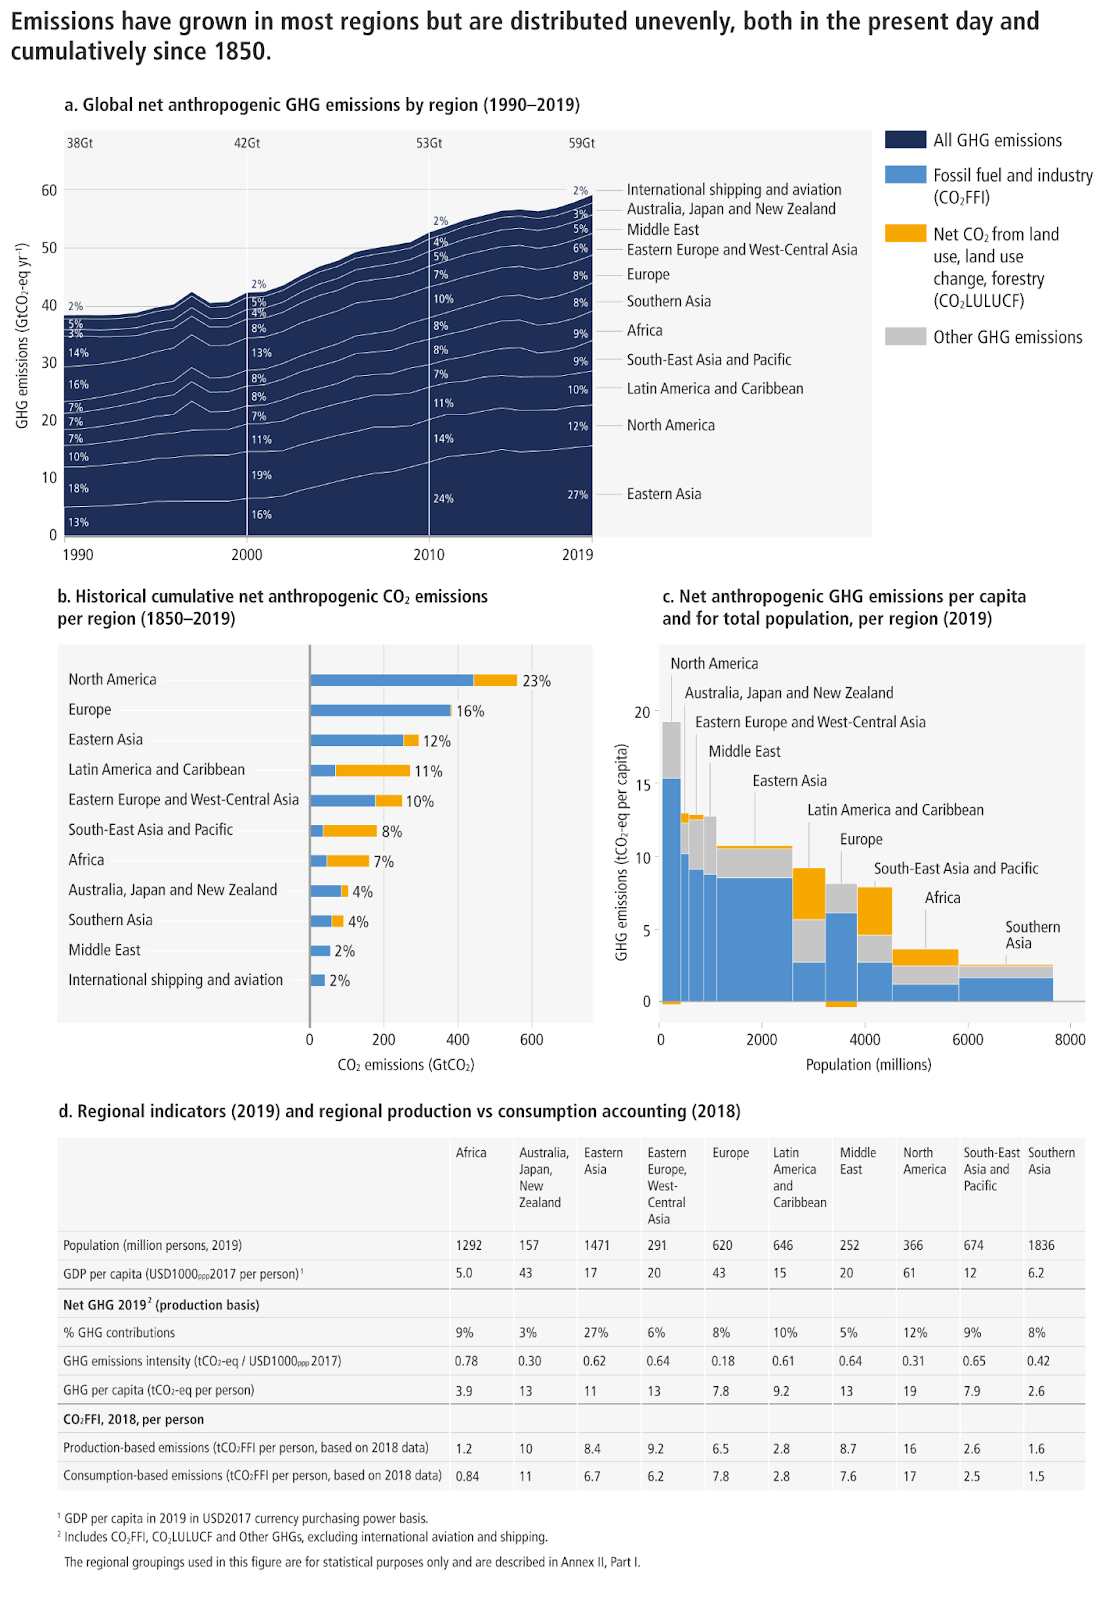
Figure SPM.2 Breaking down the global increasing trend into the regional distributions, from the aspects for the recent trend (1990-2019), historical accumulation, and GHG emission per capita.
The discrepancies between regional contributions are showing the gaps in the development stages. For example, the recent trend from 1990-2019 shows that Eastern Asia has the largest contribution to global growth. But looking from an accumulative perspective since 1850 (the beginning of the industrial revolution), Eastern Asia is ranked third, after North America and Europe.
Another evident gap is the total contribution vs per capita – North America emitted about 12% of global emissions with 366 mn population (GHG per capita 19 tCO2-eq per person) – that’s about 7 times as high as in South Asia, 8% global contribution and 1836 mn population (GHG per capita 2.6 tCO2-eq per person). (- what a cruel world)
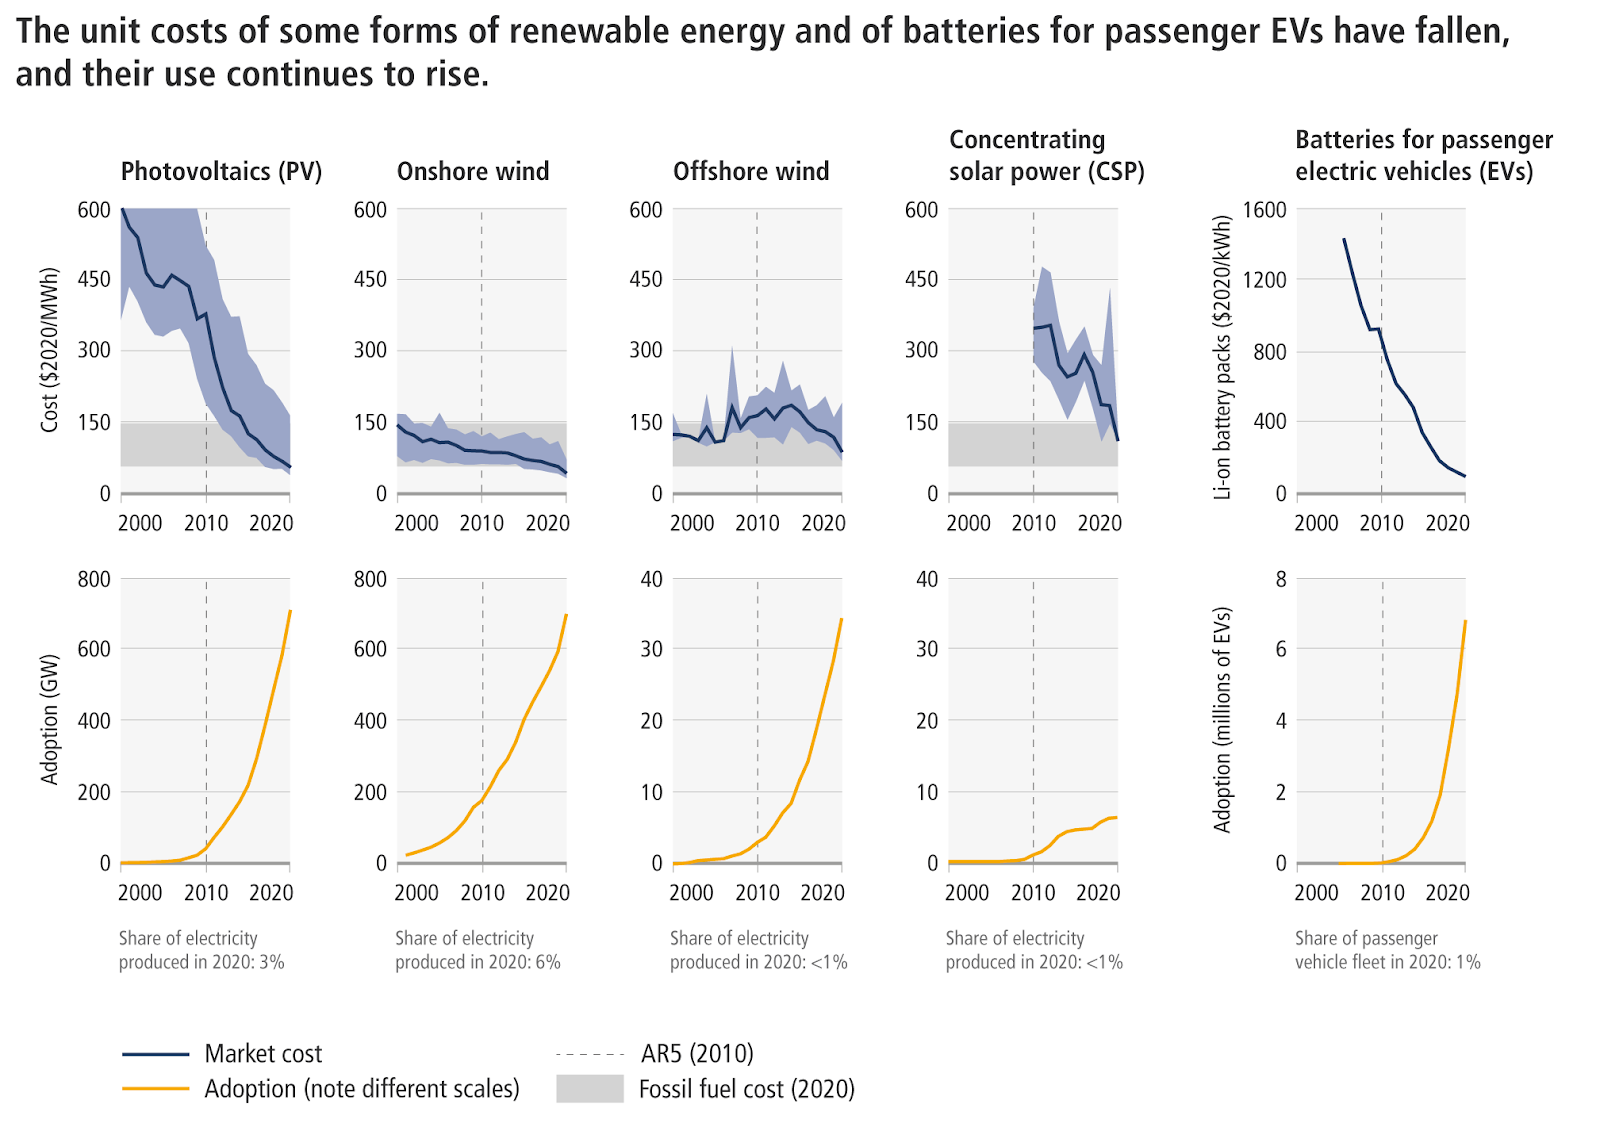
Figure SPM. 3 shows five sources of renewable energy, their costs are reducing and their use continues to rise.
A twist to look on the bright side, in order to limit fossil fuel consumption, there have been mitigations to bring down the costs of some renewable energy. Particularly for photovoltaics and Electic cars, whose costs have been drastically downed and their usage are soaring in the last 20 years (B4). Such mitigations were the benefits of a consistent expansion and a wide range of policies and laws, which are largely driven by rising awareness (B5).
Let’s take another look at our trend and projection toward the international goal of limiting global warming, which was set in the Paris Agreement (see next paragraph for further information).
The Paris Agreement – is a legally binding international treaty on climate change, signed by 196 participating countries at COP 21 in Paris. The Paris Agreement’s goal is set to limit global warming to well below 2 C, preferably to 1.5 C, as compared to the pre-industrial level. The Paris Agreement works on a 5- year cycle of increasingly ambitious climate action carried out by countries. In its first 5-year cycle, the Paris Agreement requests each country to outline and communicate their climate actions by 2020, known as the Nationally Determined Contributions (NDCs).
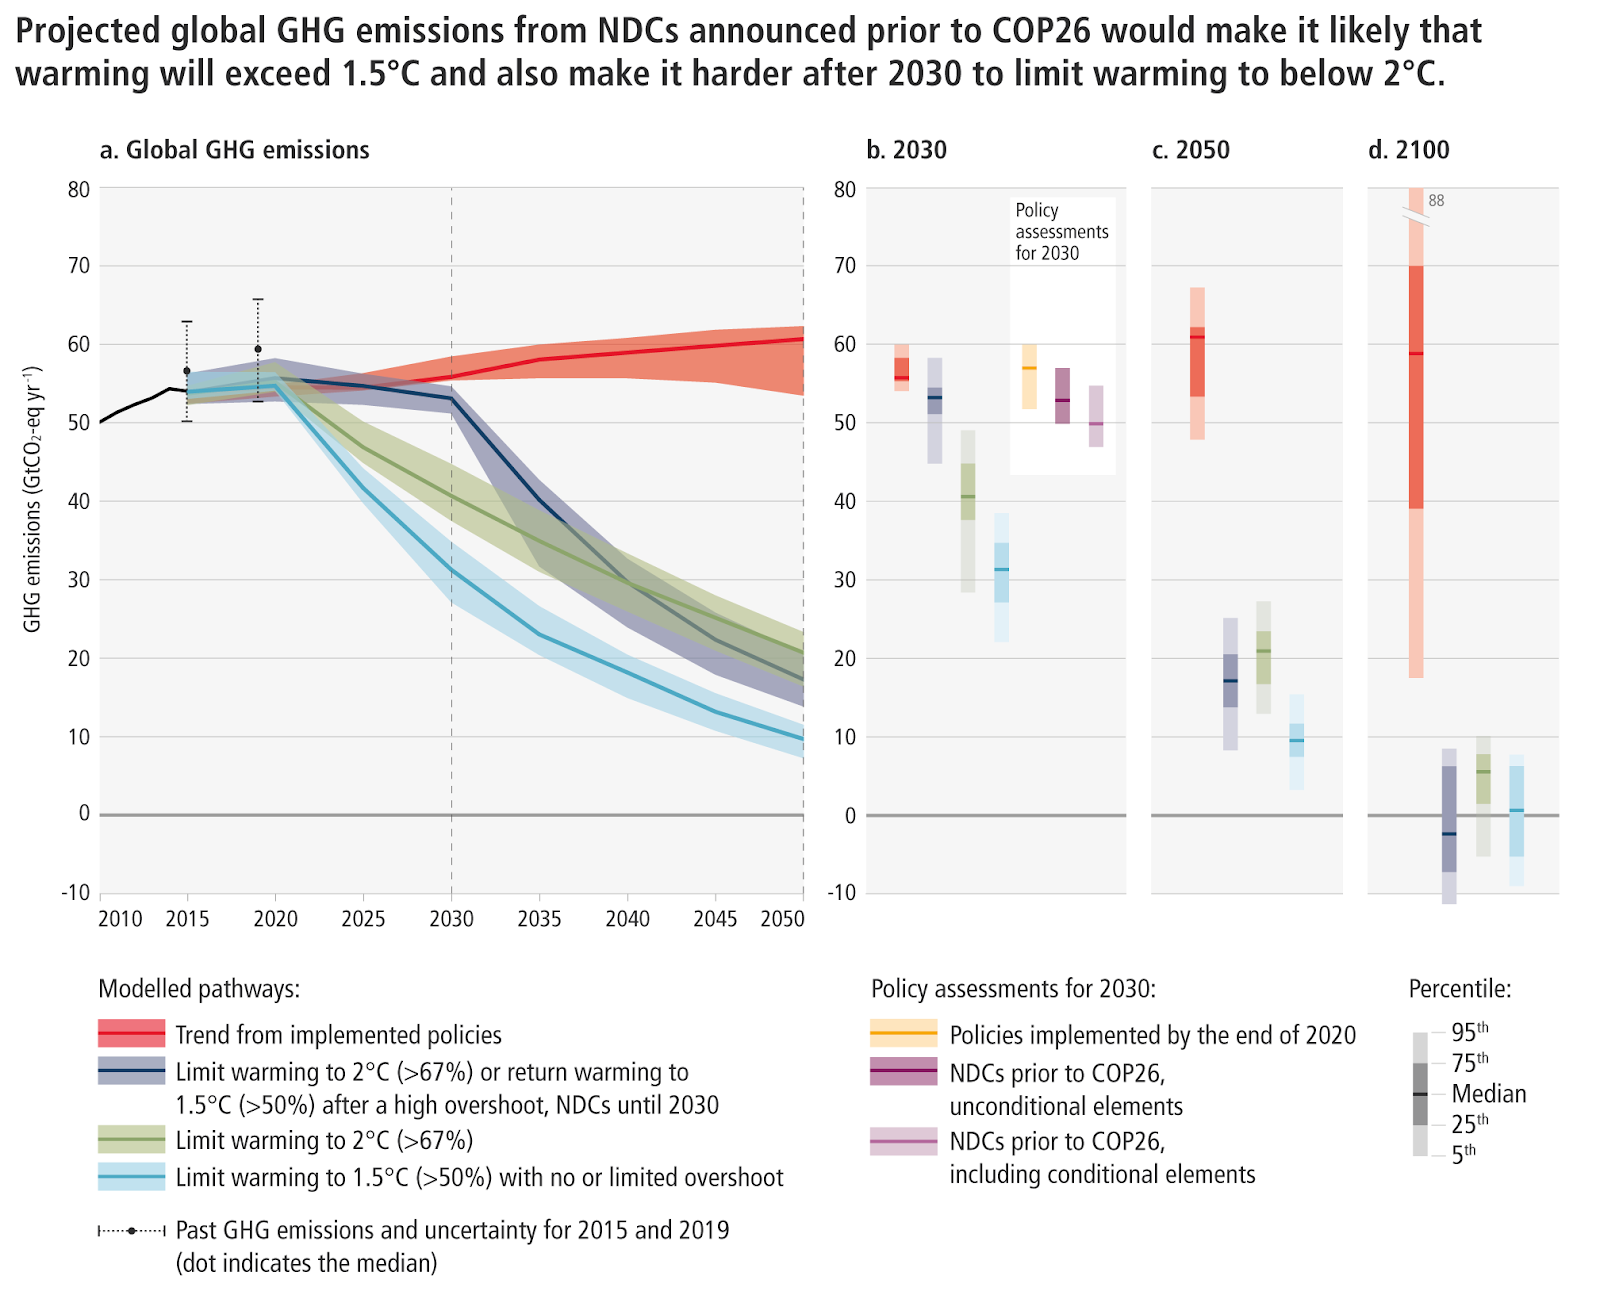
Figure SPM. 4 Modelled pathways showing the current situation and projecting future scenarios for global GHG emissions from 2010 to 2050. Three important time slices were highlighted: 2030, 2050, and 2100.
Figure SPM.4 shows us four scenarios, from the most passive (red) to the most aggressive climate actions after 2030 (black).
(Red) the trend indicates the scenario with already implemented policies, which was before the NDCs in 2020 so that making it the most passive scenario.
Two other lines (Green and Blue) suggest emission cuts required to limit warming below 2 and 1.5 C, by starting right now.
Finally, the (Black) shows a pathway with GHG emissions until taking rapid emission cut actions after 2030, making it the most aggressive emission cut scenario but requiring much higher efforts. (We will keep seeing modeled projecting pathways in the later part of the report)
But, please remember, global warming is assessed based on the accumulative GHGs level – so the take-home idea from this figure is that we need to act now and fast – the later we act the much higher burden our future generations would carry.
(Section B) Summary in one line: The current situation is far from optimistic, we are doing some good, but still not enough – we need to act fast and now.
What do we need to do? (C. Systematic transformations to limit global warming)
The answer to this question is obvious, we need immediate actions for emission reductions. Figure SPM. 5 shows the modeled pathways of total GHGs and breaking down into three major GHGs (CO2, CH4, and N2O), from 2000 to 2100. All these pathways required rapid, deep, and in most cases, immediate emission cut.
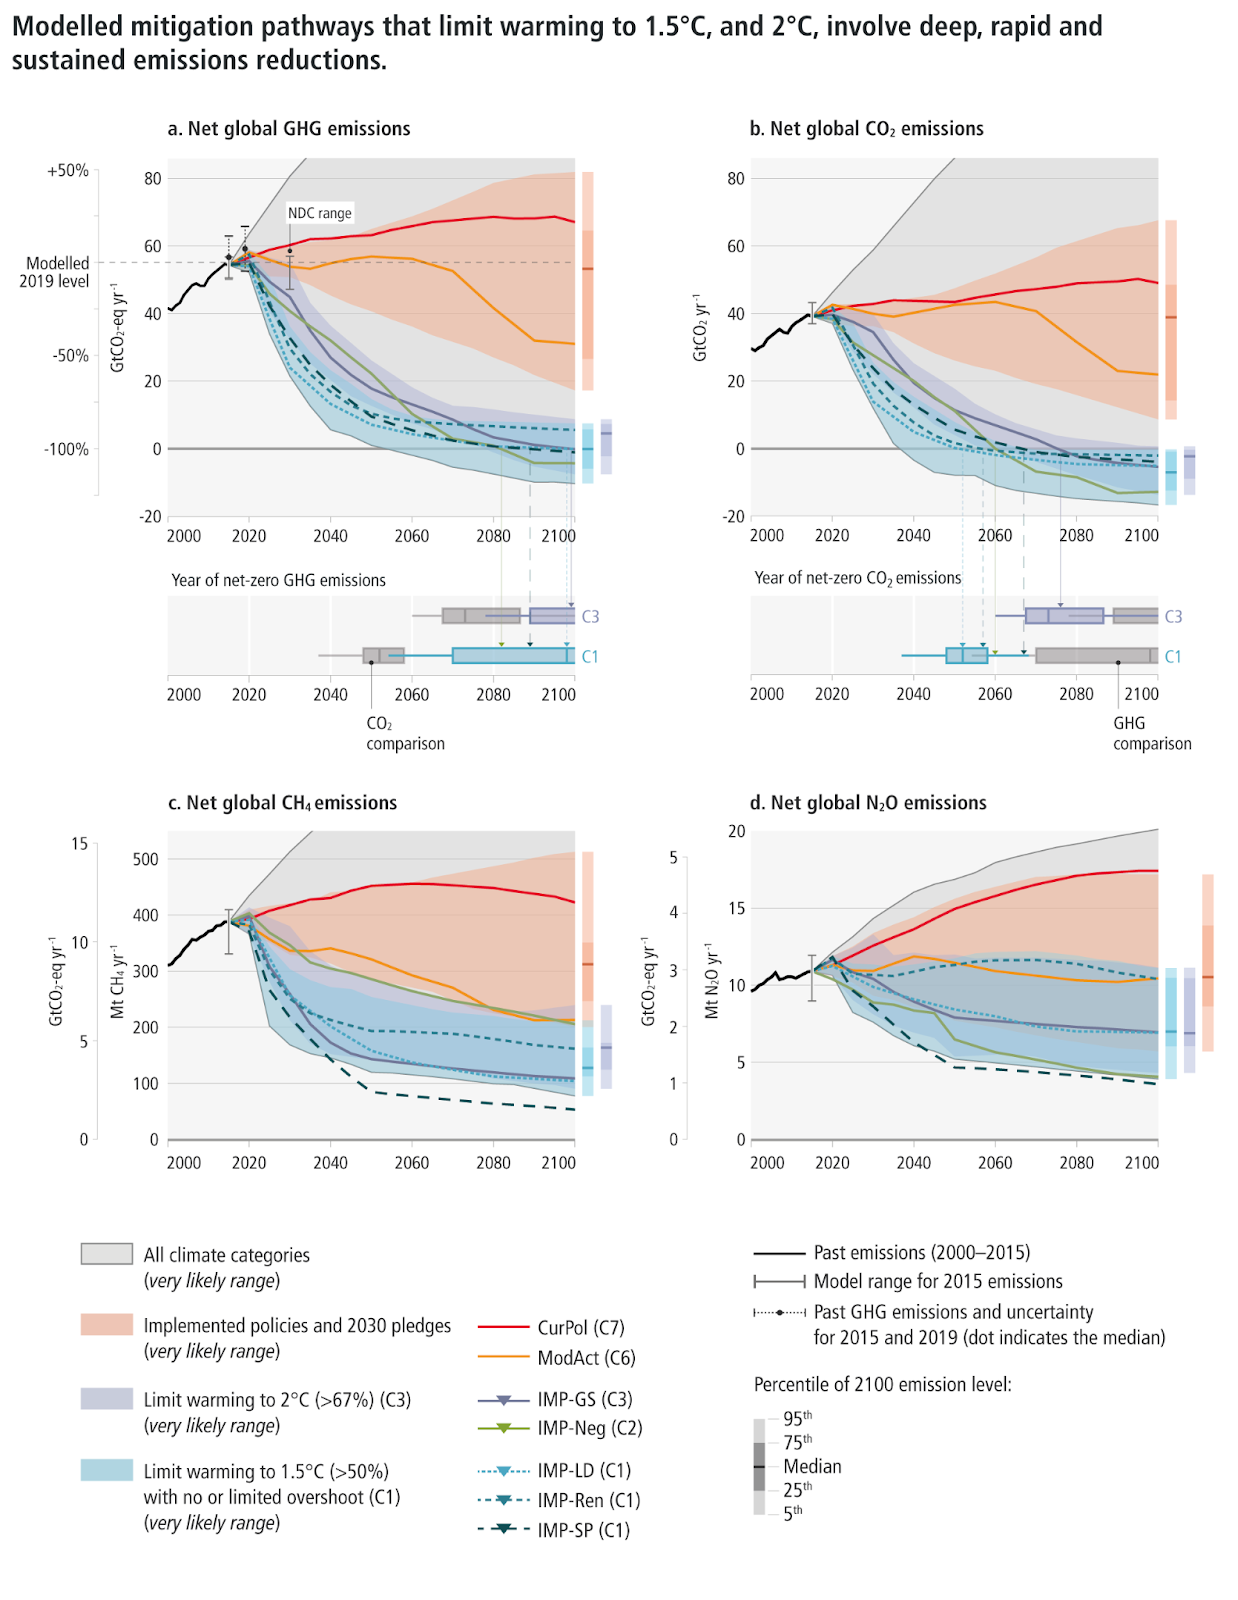
Figure SPM. 5 (a-d) Modelled pathways for the global and three major GHGs from 2000 to 2100.
On the other hand, emission reduction is not enough. Think of GHGs emissions and climate change as filling in a glass of water – the more water the glass is getting full the warmer the temperature the earth would rise. So that the first goal we need to achieve is the “global net zero CO2 emission” (C.2) – stop adding water to the glass.
To reach “global net zero”, naturally we need two solutions – the first is to reduce the water filling in, i.e. cut emissions.
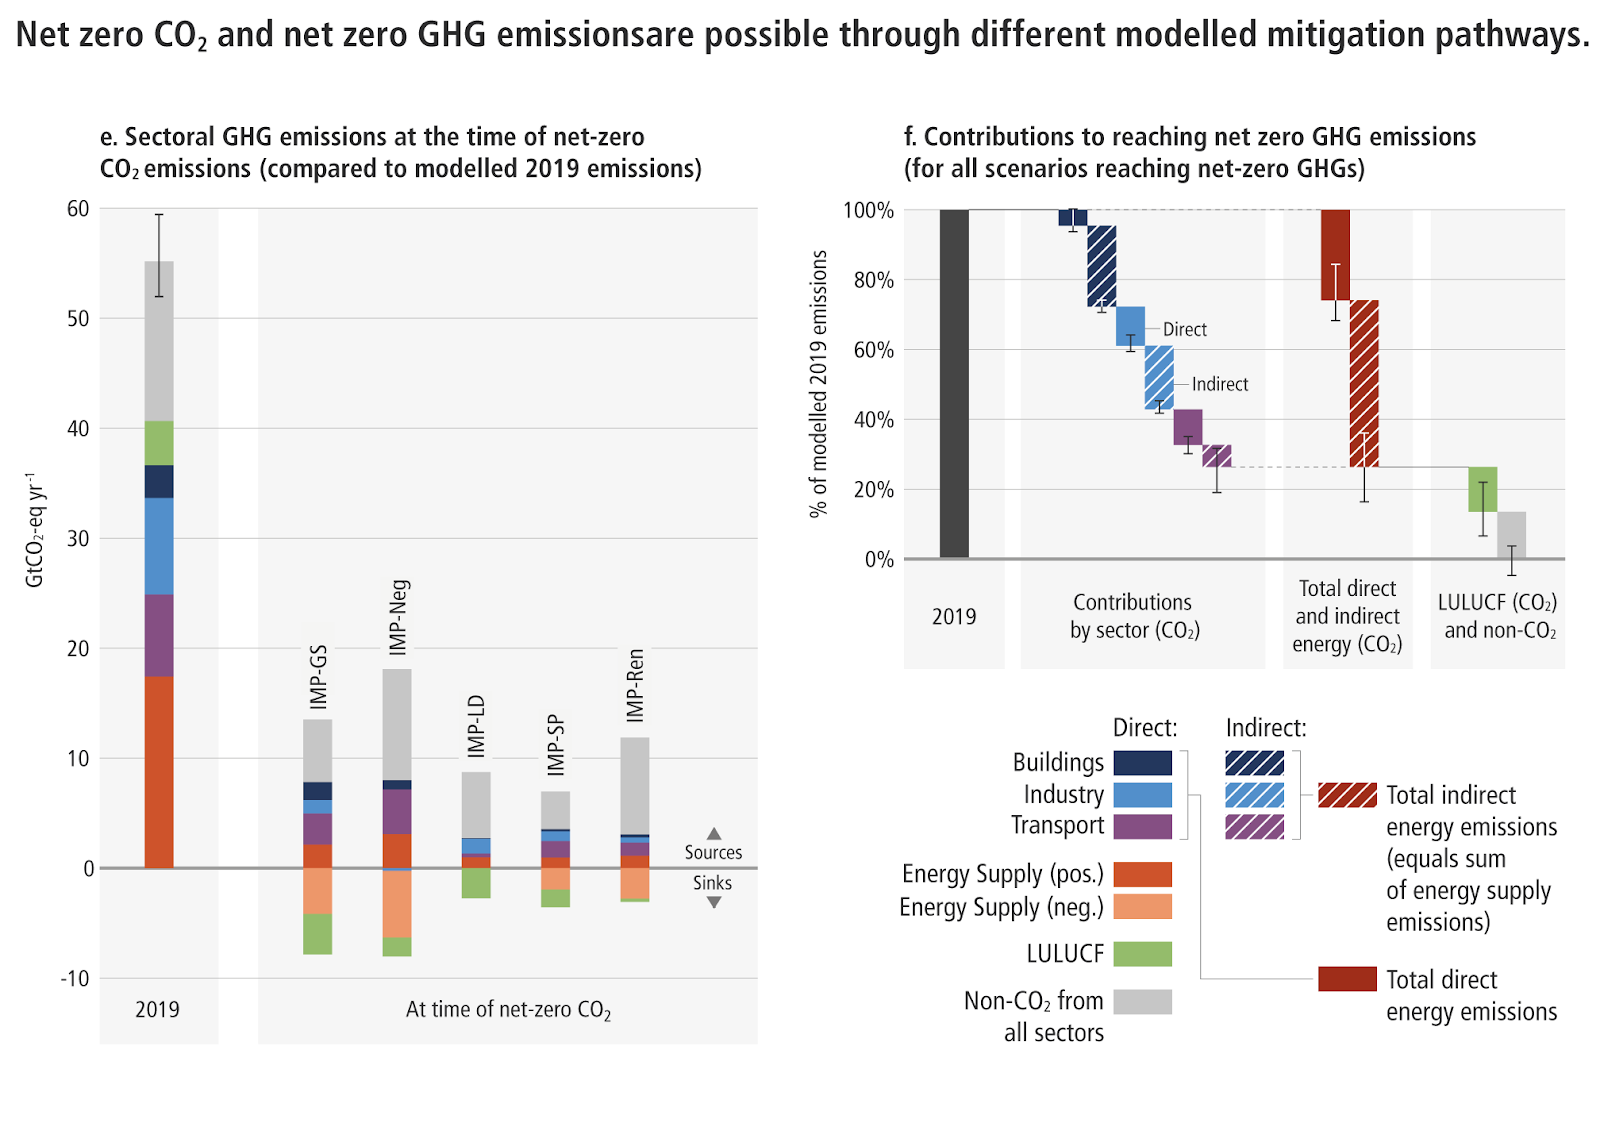
Figure SPM.5 (e,f continued) To reach net-zero illustrated by modeled pathways in e. f shows the contributions to reach net zero GHGs by all sectors, around 30% direct reduction, 30% from land use, land-use change, and forestry (LULUCF) and also non-CO2 GHGs.
Furthermore, to reach the net-zero goal, efforts are required from all sectors. The IPCC report then breaks down the reaching net zero goal into different sectors and shows us how to actually reach them. Figure SPM.5(ef) shows the contributions from these sectors in specific detail.
- In particular, the contributions from the full energy sector are highlighted, such as reducing the use of fossil fuel, switching to alternative energy carriers, and increasing energy efficiency and conservation (C4).
- The runner-up to net zero CO2 is from the industrial sector – challenging but still possible. This will require coordination throughout the production chains, including demand management, promoting energy- and material efficiency, recycling material flows, and adopting low-emission electricity, hydrogen, fuel, etc (C5).
- The urban areas living environment can be a frontline in achieving the net-zero emission goal, by shifting towards a systemic transition of infrastructure and urban design. Three strategies are mentioned: (i) reducing or changing energy and material consumption, (ii) electrification, and (iii) enhancing carbon uptake and storage in the urban environment (C6). These actions depend on highly motivated and effective policy packages for the buildings that have been existed or yet to be built (C7).
- Transport sector – both developed and developing countries may benefit from low-GHG emission technologies and demand-side options. Demand-focused interventions (encourage consumers to use less energy over peak hours or shift to off-peak hours) can reduce the overall demands from all transport services and support the shift to a more energy-efficient transport model. Electric vehicles are a great example – it offers the largest decarbonization potential on a lifetime basis. Sustainable biofuels and low-emission hydrogen are other examples to cut CO2 emissions (C8).
- The agriculture, forestry, ocean, and land use (AFOLU) sector – can deliver large-scale emission cuts but is hard to implement. Although there have been urgent calls for sustainably sourced agricultural products, the impacts of climate change, and competing demands on land – especially regarding food security and livelihoods – have set drastical barriers in this regard (C9).
- Infrastructure use – also contributes to demand-side mitigation and requires end-use technology adoption and socio-cultural changes. This sector will also bring in a broader impact that fits into improving basic well-being for all (C10).
- However, only reducing the GHG emissions to the atmosphere is not enough, we need an effective approach also to remove residual CO2 too – here comes the deployment of carbon dioxide removal (CDR) (C11). (CDR refers to anthropogenic activities that remove CO2 from the atmosphere and store it durably in geological, terrestrial, or ocean reservoirs, or in products. CDR methods vary in terms of their maturity, removal process, the time scale of carbon storage, storage medium, mitigation potential, cost, co-benefits, impacts and risks, and governance requirements)
What are the costs and effects of these approaches?
For the abovementioned approaches to cut down the cost of GHGs emissions and CDR, Figure SPM. 7 shows their cost and potential to reduce them.
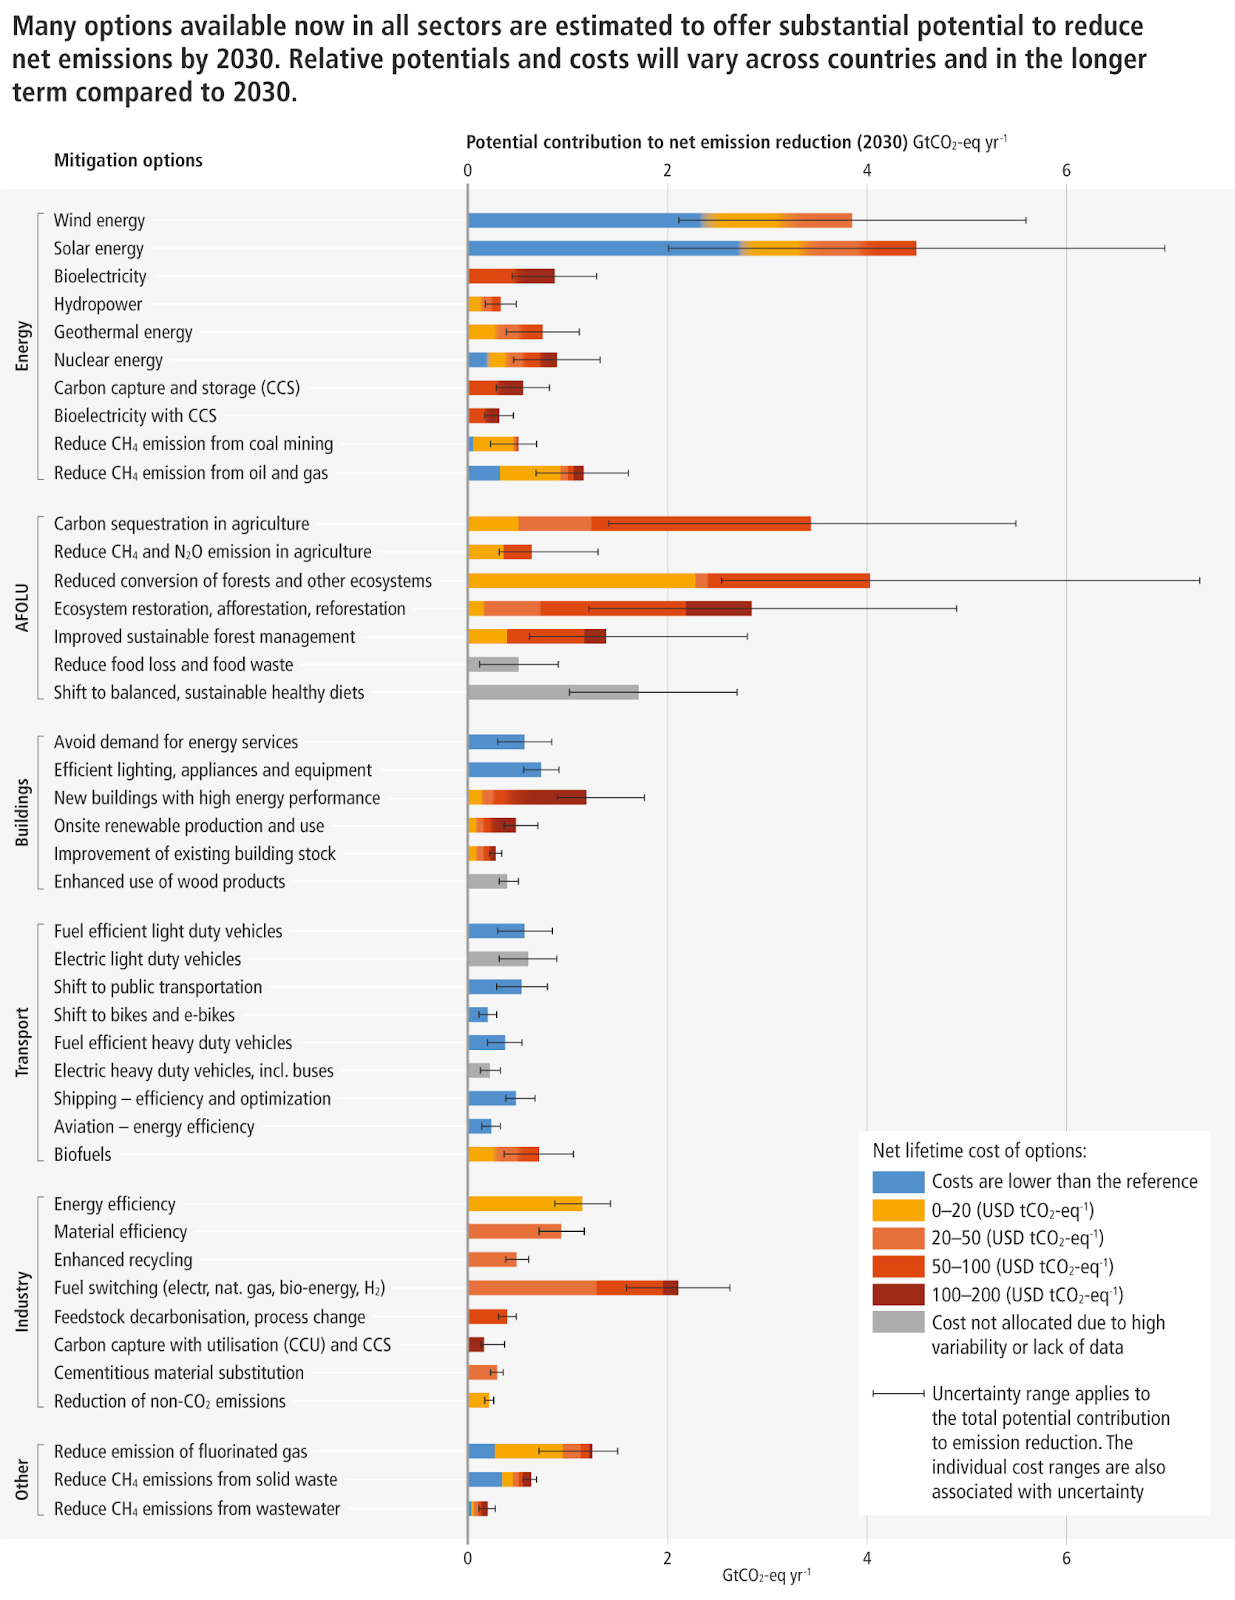
Figure SPM.7 demonstrates a highly informative roadmap for many of the mitigation strategies across all sectors mentioned above. It clearly suggests the areas we will harvest the most benefit while also pointing out the area that is most difficult to tackle.
The blue bars are the low-hanging fruits while the red bars are the hard nuts to crack. The two obvious blue bars are wind and solar energy which is encouraging for large-scale deployment. Many of the red bars are in the Agriculture, Forest, Ocean, and other land use (AFOLU) sector – agricultural contribution to CO2 emission really difficult to deal with.
Finally, while the cost of some mitigation options is high at the moment, one particular number to look for is the cost of reducing tCO2-equivalent of 100USD in 2019 could be reduced by half in 2030. When weighing the long-term benefit to the global economy, limiting warming to 2C would exceed the cost of mitigation (C12).
(Section C) Summary in one line: We need systematic transformation in all sectors and their costs and effects vary – therefore coordinated cross-sectoral policies and planning will be crucial.
Climate actions in synergies and trade-offs with the UN Sustainable Development Goals
Climate actions are in critical need to mitigate and adapt to climate change, however, some options will inevitably introduce trade-offs. To provide a basic guideline for assessing its synergies and trade-offs, the UN 2030 Agenda for Sustainable Development can provide some guidance to assess these climate actions (D1).
The figure below entails a graphic list of the 17 UN Sustainable Development Goals (SDGs) and Figure SPM.8 provides a comprehensive list of the climate actions and their interactions with 17 SDGs.
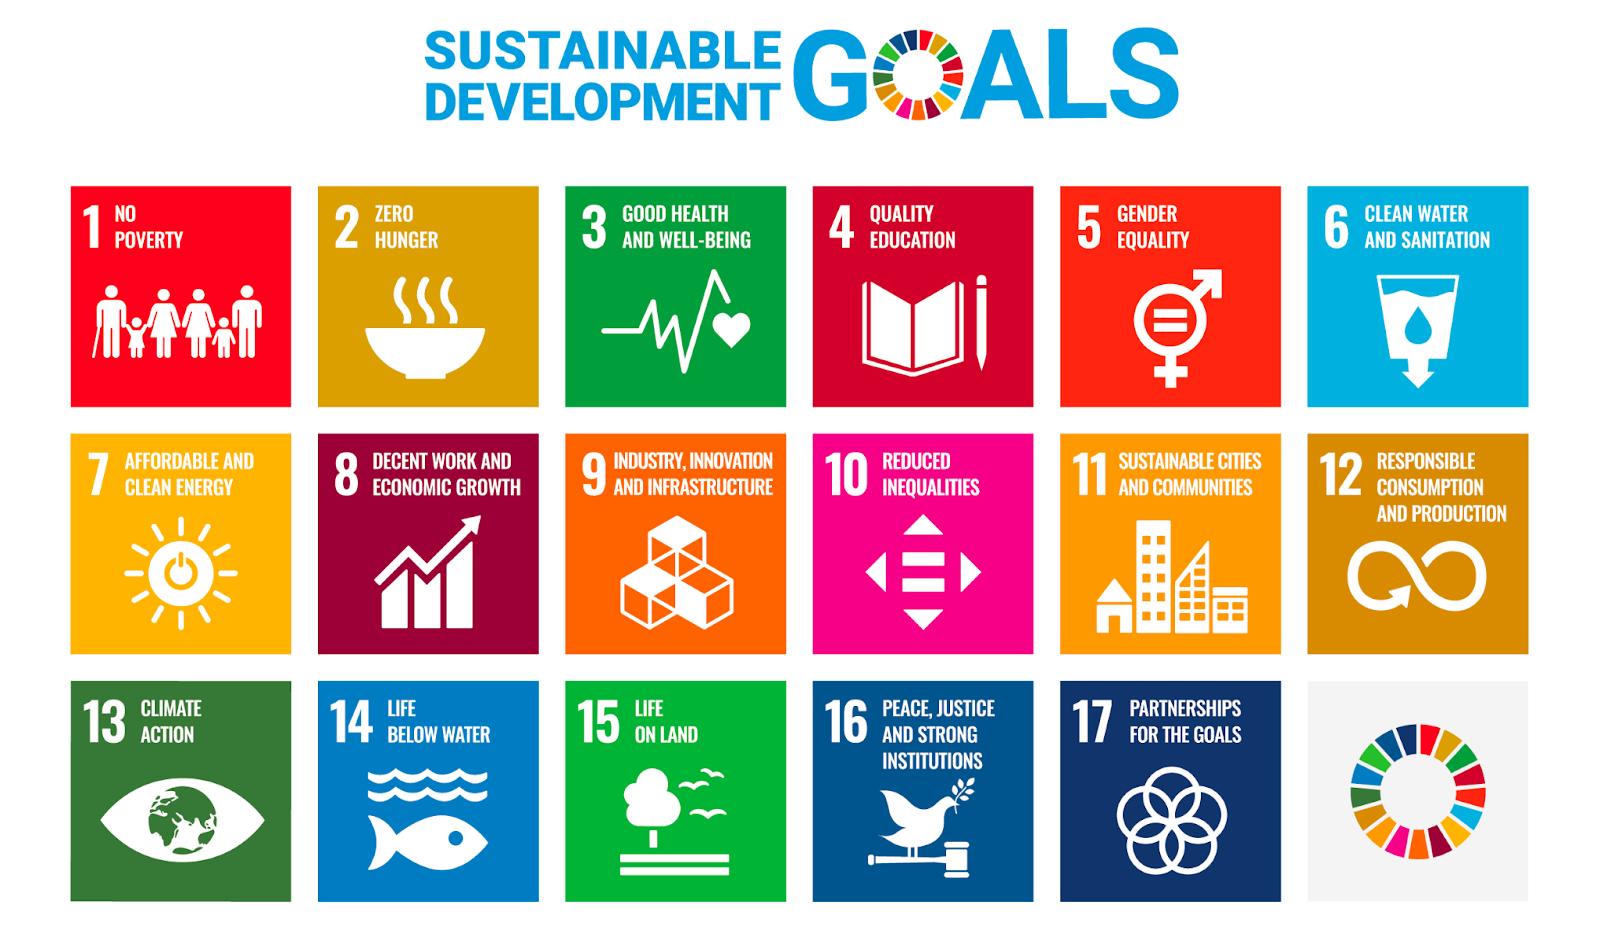
17 UN Sustainable Development Goals (SDGs)
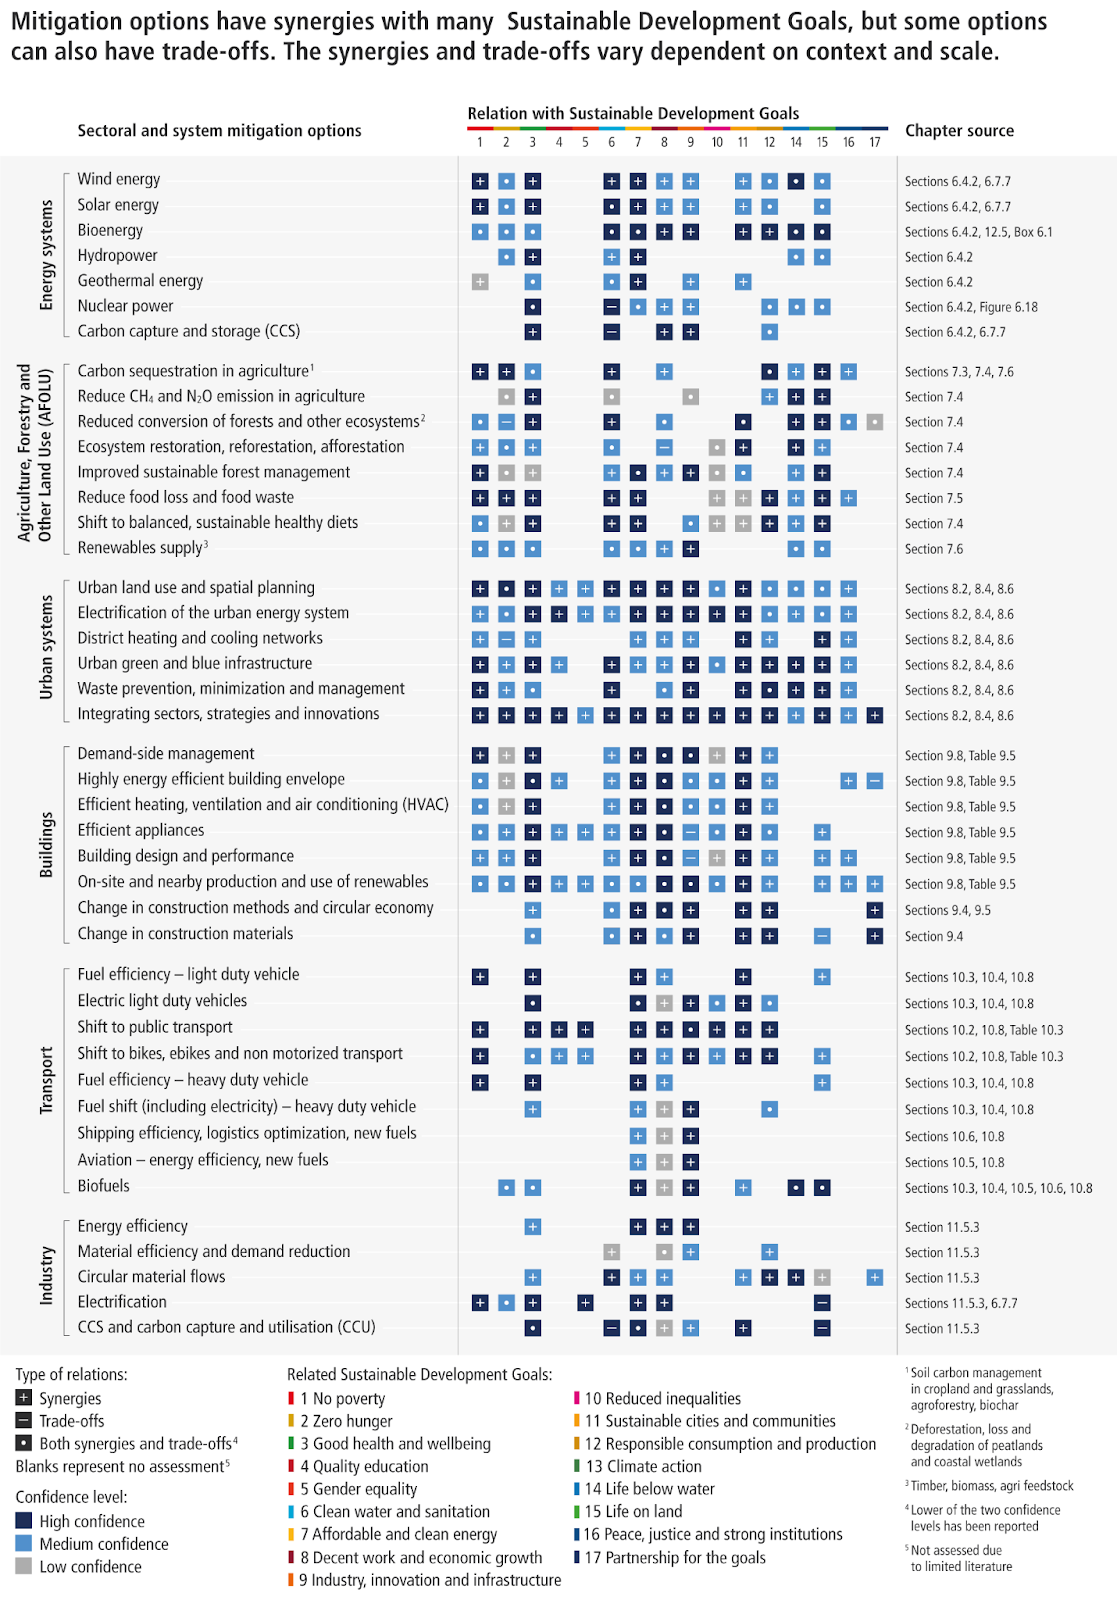
Figure SPM. 8 Climate actions in relationship with SDGs.
There is a strong link between sustainable development, vulnerability, and climate risks. Developing countries with limited economic and social resources often lead to high vulnerability and low adaptability, and capacity.
Several responses in human settlements, land management, and related to ecosystems deliver both mitigation and adaptation (synergies). However, land and aquatic ecosystems can be adversely impacted by some mitigation actions (trade-offs). An easy way to understand synergies and trade-offs is that implementing such climate actions would also provide positive (synergies) or negative (trade-offs) impacts on other SGDs. So, this is where special attention is required that calls for coordinated cross-sectoral policies and planning to maximize synergies while avoiding or reducing trade-offs from adopting climate actions.
Last but not the least, some additional thinking
I hope you enjoy reading this small summary (maybe not but I try to summarize the 50+ pages report to about 2000+ words). Now, maybe it is time to take some further thinking and questioning – where are we going next and what else should we do? In this section, I provide a
- What are the alternatives to fossil fuels?
- What is the cost-efficiency of these methods of cutting carbon emissions? (Figure SPM.7)
- How sustainable are these methods? – how are they connected with the UN Sustainable Development Goals (Figure SPM.8)? Should we promote more synergies while postponing the trade-off part? What attitude should we take towards these mitigations, regarding SDGs?
- What are the adaptable measures for each level of stakeholders – i.e. state governments, social communities, and individuals?
- What kind of policies, laws, institutions, and regulations are needed, regarding such required changes in need (E.3)?
The above questions are more related to the report itself. Then we can further extend the scope to include some real-time issues that happened just recently:
- How effective is the Paris Agreement to materialize its goal of facilitating CO2 emission cuts and limiting global warming to 1.5 C by the end of 2100? (E.6) (The answer is actually in Figure SPM.5 different modeled pathways showing the likelihood of limiting global warming below 1.5 or 2 C)
- What is the position of the recent US Inflation Reduction Act (IRA) in regards to its tight connection with the renewable energy sector – i.e. how does it connects with/contribute to the emission goal of tackling climate change?
- What is the role of the current ongoing conflicts between Russia and Ukraine contributing to the instability of energy sectors in Europe and the rest of the world – The shortage in natural gas from Russia has driven the energy cost soaring into the sky.
In response, many EU states are reconsidering options like coal power to compensate for heating this winter. Meanwhile, the US is postponing coal power closure amidst a clean energy setback. Moreover, the recent summer drought in Southern China, an upstream province in the Yangtze River, has shockingly reduced the river flow in the Yangtze River and limited the power potential for the Three Gorges Dam hydro-power, causing residential power cut in Sichuan, one upstream province to the dam amidst heatwaves over 42 C.

Leave a Reply